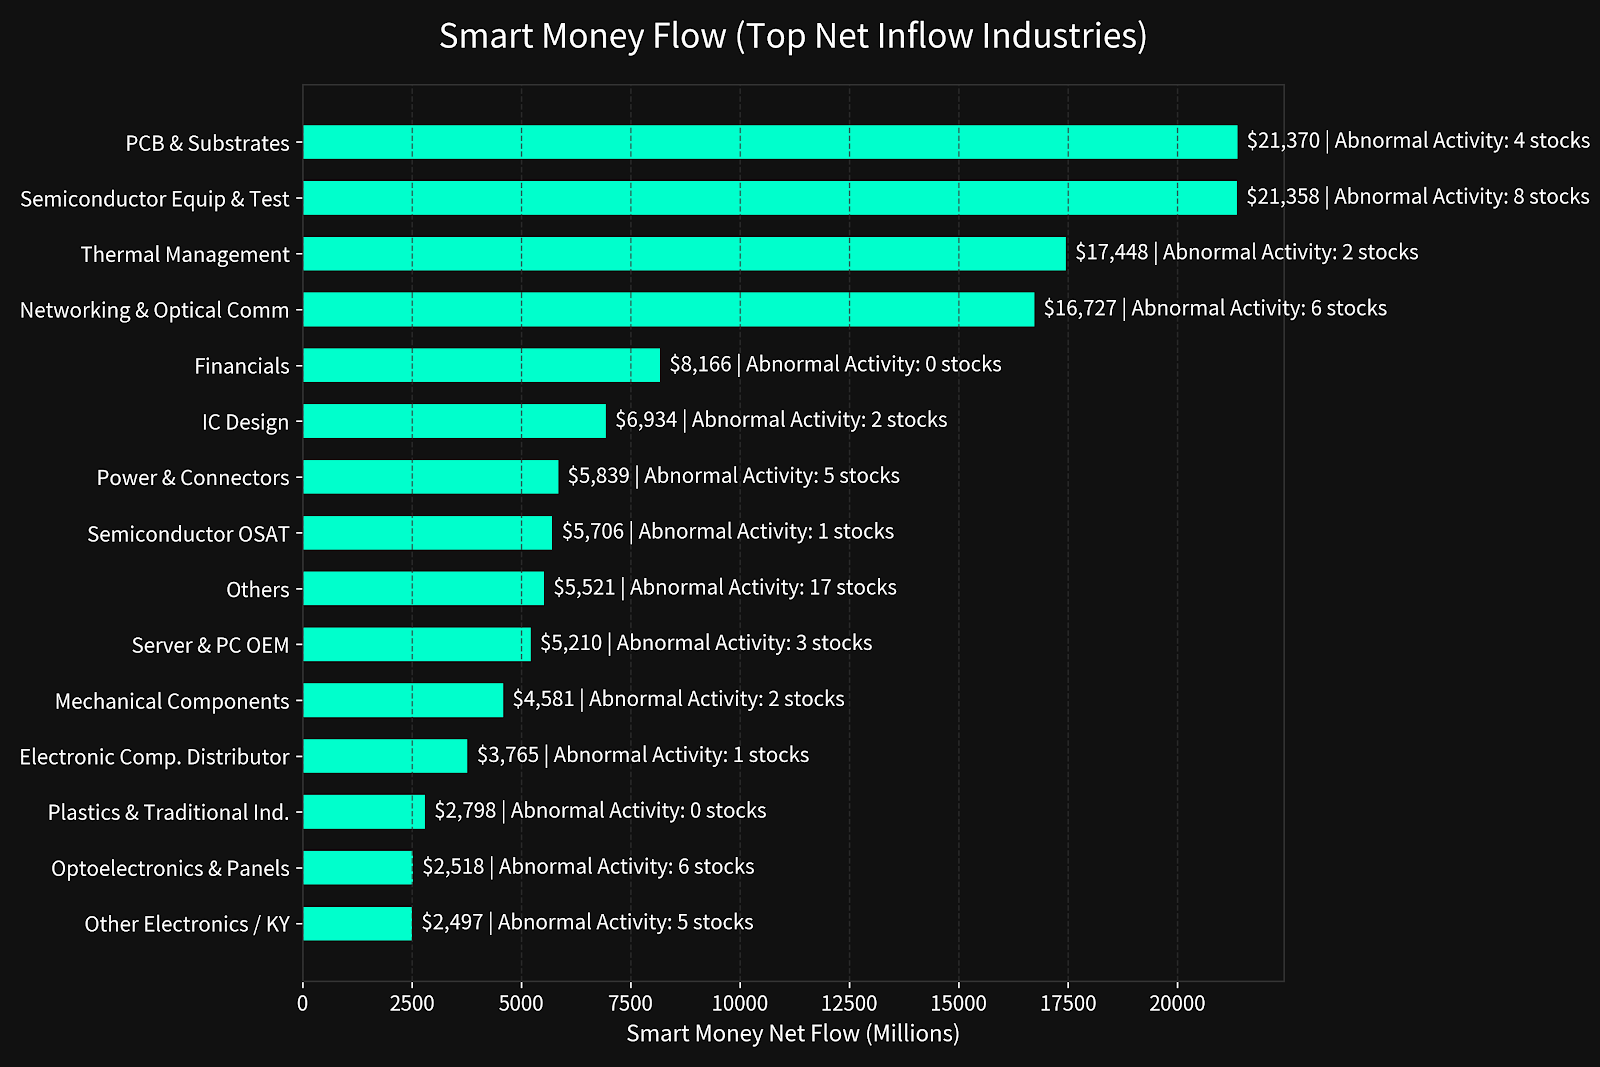
Observing this week's Smart Money Flow Indicator histogram, the flow of smart money shows an extremely asymmetric and highly concentrated phenomenon. Capital has completely withdrawn from traditional cyclical and consumer sectors, reallocating heavily towards defensive and structural growth areas, particularly in the "infrastructure and specification upgrades" sector, which aims to address the physical limits of AI computing power.
The top three sectors with the largest net capital inflows this week and their macro logic are as follows:
1. PCB and Substrates (Net Inflow of 21.37 billion) — Pricing Power Driven by Specification Upgrades
As the sector with the largest absolute capital absorption this week, the macro logic is based on the rigid demand of next-generation AI servers for high-layer, large-area ABF substrates. Institutional funds are betting on the crowding-out effect and pricing power of high-end substrate capacity. However, such a massive convergence of capital implies extremely high chip liquidity in this segment, indicating that while funds are betting on a long-term infrastructure consensus, they are also providing ample liquidity cover for major players to adjust positions and rotate holdings at high levels.
2. Semiconductor Equipment and Testing (Net Inflow of 21.35 billion) — Breaking the Hard Barrier of Moore's Law
This sector is currently the core stronghold with the strongest bullish consensus in the market. As chip scaling approaches physical limits, advanced packaging (CoWoS / FOPLP) and high-frequency test probes have become the only solutions for computing power leaps. The substantial entry of smart money here represents a typical "selling shovels" investment logic: rather than betting on the end sales of a single chip manufacturer, it invests in the inevitable expansion of the entire industry chain. This sector, characterized by extremely high technological moats, provides an excellent safe haven for capital during periods of high-level index volatility.
3. Thermal Management / Networking and Optical Communications (Combined Net Inflow of over 34 billion) — Thermodynamics and Transmission Revolution in Computing Centers
In the latter half of the current AI arms race, the core bottlenecks have shifted from computing power shortages to "heat dissipation" and "data latency." Capital is highly concentrated in thermal management (net inflow of 17.448 billion) and networking and optical communications (net inflow of 16.727 billion), reflecting the long-term strategic perspective of Wall Street and institutional investors: transitioning from air cooling to liquid cooling, and from traditional copper wires to co-packaged optics (CPO). This is not short-term speculative hype but a long-term capital expenditure cycle based on the fundamental re-engineering of rack-level power and physical architecture.
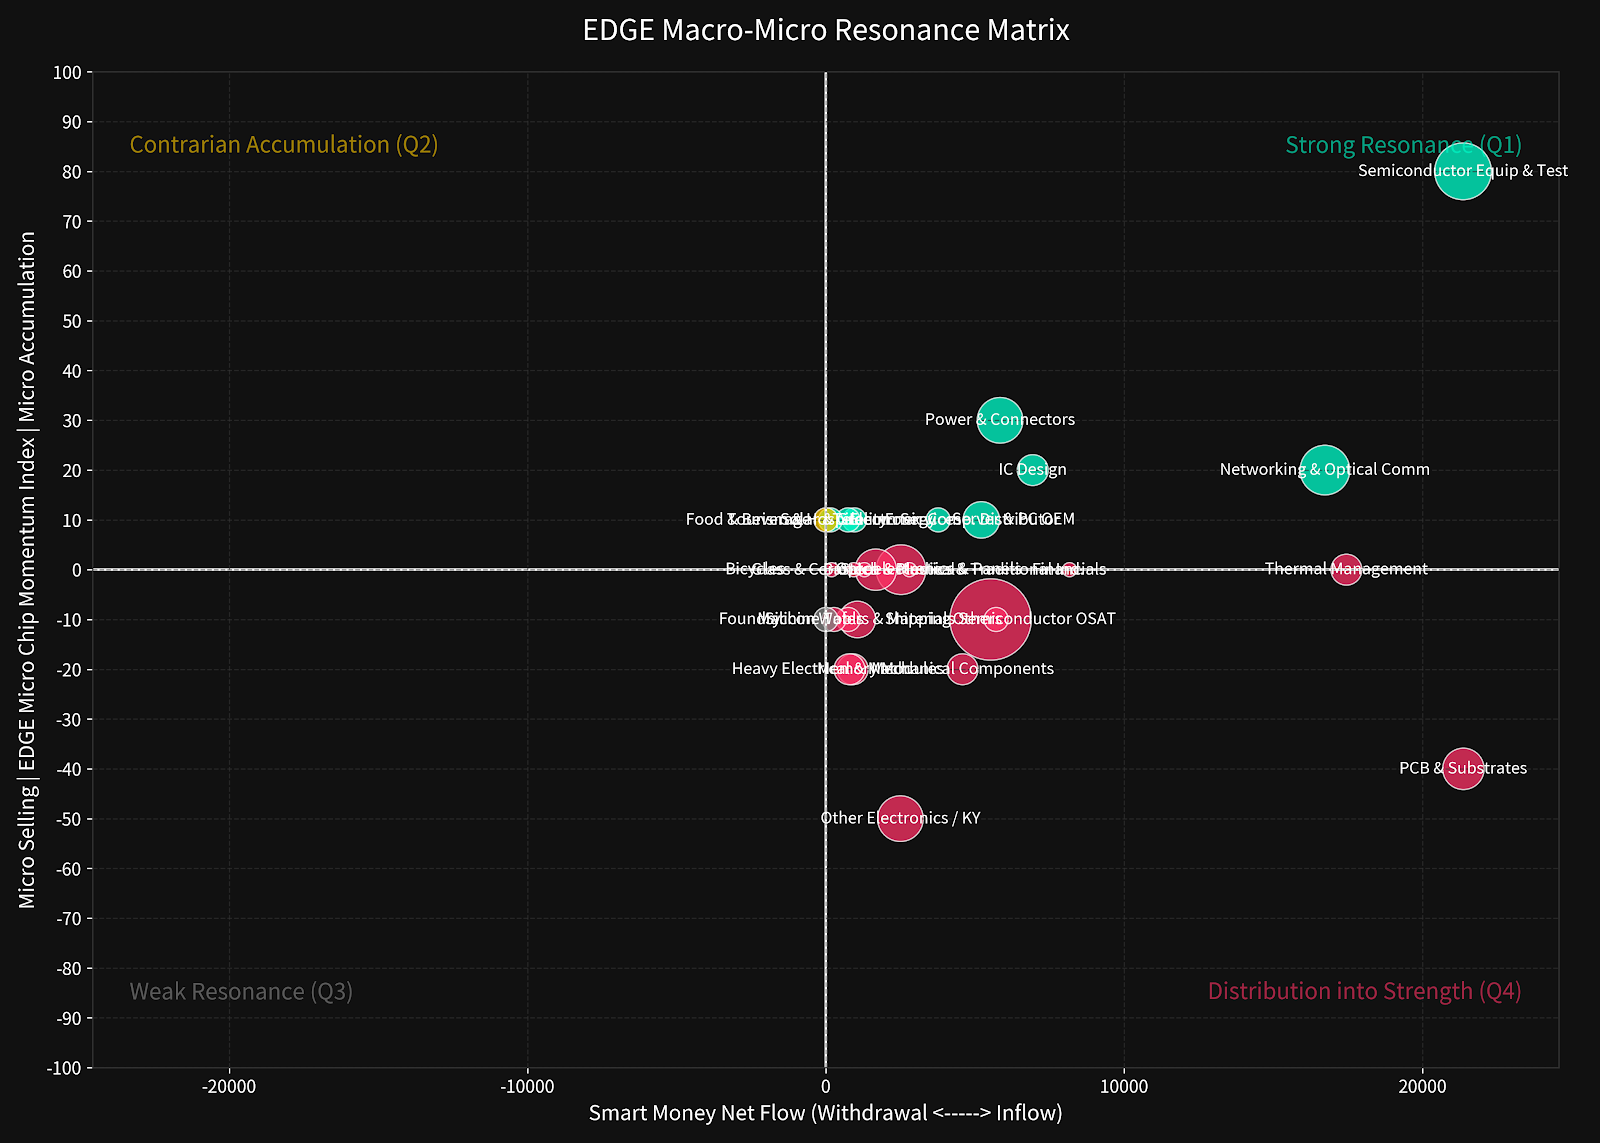
📌 EDGE Industry Resonance Scan (Matrix Chart & Scorecard)
Matrix Distribution and Micro-level Chip Analysis Through the EDGE Industry Resonance Bubble Matrix, we can cross-reference "macro-level capital net flows (X-axis)" with "micro-level chip momentum index (Y-axis)" to uncover the true intentions of market capital. This week's four-quadrant capital distribution shows extreme divergence and high hidden characteristics:
Q1 Strong Resonance Zone (Primary Uptrend Consensus): Includes semiconductor equipment and testing, networking and optical communications, power and connectors, and IC design. These sectors not only attracted massive net inflows of smart money but also showed absolute "bullish purity" in micro-level chip momentum, indicating that institutional investors and major players are in an uncompromising, consistent accumulation phase, with an extremely high chip lock-up rate.
Q2 Counter-trend Accumulation Zone (Defensive Positioning): Represented by the food sector. Despite the market's capital heavily tilting towards technology stocks, this sector showed no significant macro-level capital inflow, but micro-level abnormal accumulation characteristics emerged, reflecting that some long-term defensive funds are utilizing low volatility for left-side accumulation.
Q3 Weak Resonance Zone (Liquidity Exhaustion): Sectors like wafer foundries fell into this area, showing no macro-level capital preference and a bearish alignment at the micro-level, indicating that these sectors are temporarily marginalized by smart money in the current capital rotation cycle.
Q4 High-Price Distribution Zone (Chip Trap): This is the most cautionary quadrant this week. Sectors led by PCB and substrates, mechanical components, and heavy electrical/motors, outwardly showed massive net inflows of smart money (a high Beta illusion), but their micro-level chip momentum (E-value) showed extreme negative values, with bearish purity as high as 100%. This strongly suggests that major players are using the macro-level thematic热度 to release liquidity, conducting actual high-price distribution and rotation.
【EDGE Industry Resonance Scorecard】
Industry Sector
Smart Money Momentum
Abnormal Accumulation Heat
EDGE Micro-level Chip Momentum
Chip Cohesion
Quadrant Position
Semiconductor Equipment and Testing
🟢 Net Inflow 21,357.86
Level 5
+80
Bullish 100.0%
Q1 Strong Resonance Zone
Networking / Optical Communications
🟢 Net Inflow 16,727.29
Level 5
+20
Bullish 66.7%
Q1 Strong Resonance Zone
Power and Connectors
🟢 Net Inflow 5,838.74
Level 5
+30
Bullish 80.0%
Q1 Strong Resonance Zone
Conglomerates / Others
🟢 Net Inflow 5,521.42
Level 5
-10
Bearish 52.9%
Q4 High-Price Distribution Zone
Optoelectronics / Panels
🟢 Net Inflow 2,517.84
Level 5
0
Mixed/Contested 50.0%
Q4 High-Price Distribution Zone
Other Electronics / Overseas
🟢 Net Inflow 2,497.04
Level 5
-50
Bearish 100.0%
Q4 High-Price Distribution Zone
PCB and Substrates
🟢 Net Inflow 21,370.25
Level 4
-40
Bearish 100.0%
Q4 High-Price Distribution Zone
Servers / Computer OEMs
🟢 Net Inflow 5,210.46
Level 4
+10
Bullish 66.7%
Q1 Strong Resonance Zone
Biotech and Healthcare
🟢 Net Inflow 1,673.57
Level 4
0
Mixed/Contested 50.0%
Q4 High-Price Distribution Zone
Shipping
🟢 Net Inflow 1,055.90
Level 4
-10
Bearish 66.7%
Q4 High-Price Distribution Zone
Thermal Management
🟢 Net Inflow 17,448.21
Level 3
0
Mixed/Contested 50.0%
Q4 High-Price Distribution Zone
IC Design
🟢 Net Inflow 6,934.14
Level 3
+20
Bullish 100.0%
Q1 Strong Resonance Zone
Mechanical Components
🟢 Net Inflow 4,580.71
Level 3
-20
Bearish 100.0%
Q4 High-Price Distribution Zone
Semiconductor Packaging and Testing
🟢 Net Inflow 5,706.36
Level 1
-10
Bearish 100.0%
Q4 High-Price Distribution Zone
Food
0.00
Level 3
+10
Bullish 100.0%
Q2 Counter-trend Accumulation Zone
Wafer Foundries
0.00
Level 3
-10
Bearish 100.0%
Q3 Weak Resonance Zone
📌 Featured Themes Deep Dive Analysis
Below, we will peel back the data's surface to provide an in-depth micro-level perspective on this week's most representative strategic focus industries, combining quantitative chip analysis with qualitative driving factors.
This post is for subscribers only
Sign up now to read the post and get access to the full library of posts for subscribers only.
【Industry Capital Flow Weekly】20260316 Major Player Capital Highly Converges on Hardware Infrastructure, Micro-level Bullish-Bearish Divergence Intensifies
【Insight Subscription Plan】Say Goodbye to Retail Investor Mentality: Using "Quantitative Fund Flow" and "Consensus Data" to Build Your Alpha Trading System
![[Industry Capital Flows Weekly] 20260309 Capital Reallocation and Micro-level Capital Flow Divergence in AI Infrastructure](/content/images/size/w2000/2026/03/Gemini_Generated_Image_9yzcdz9yzcdz9yzc-1.png)

![[Industry Capital Flows Weekly] 20260215 Capitalizing on AI Specification Bonuses, Avoiding Equipment Makers' Book-Closing Sell-off](/content/images/size/w1200/2026/03/Gemini_Generated_Image_mq6ktymq6ktymq6k-1.png&q=100)

