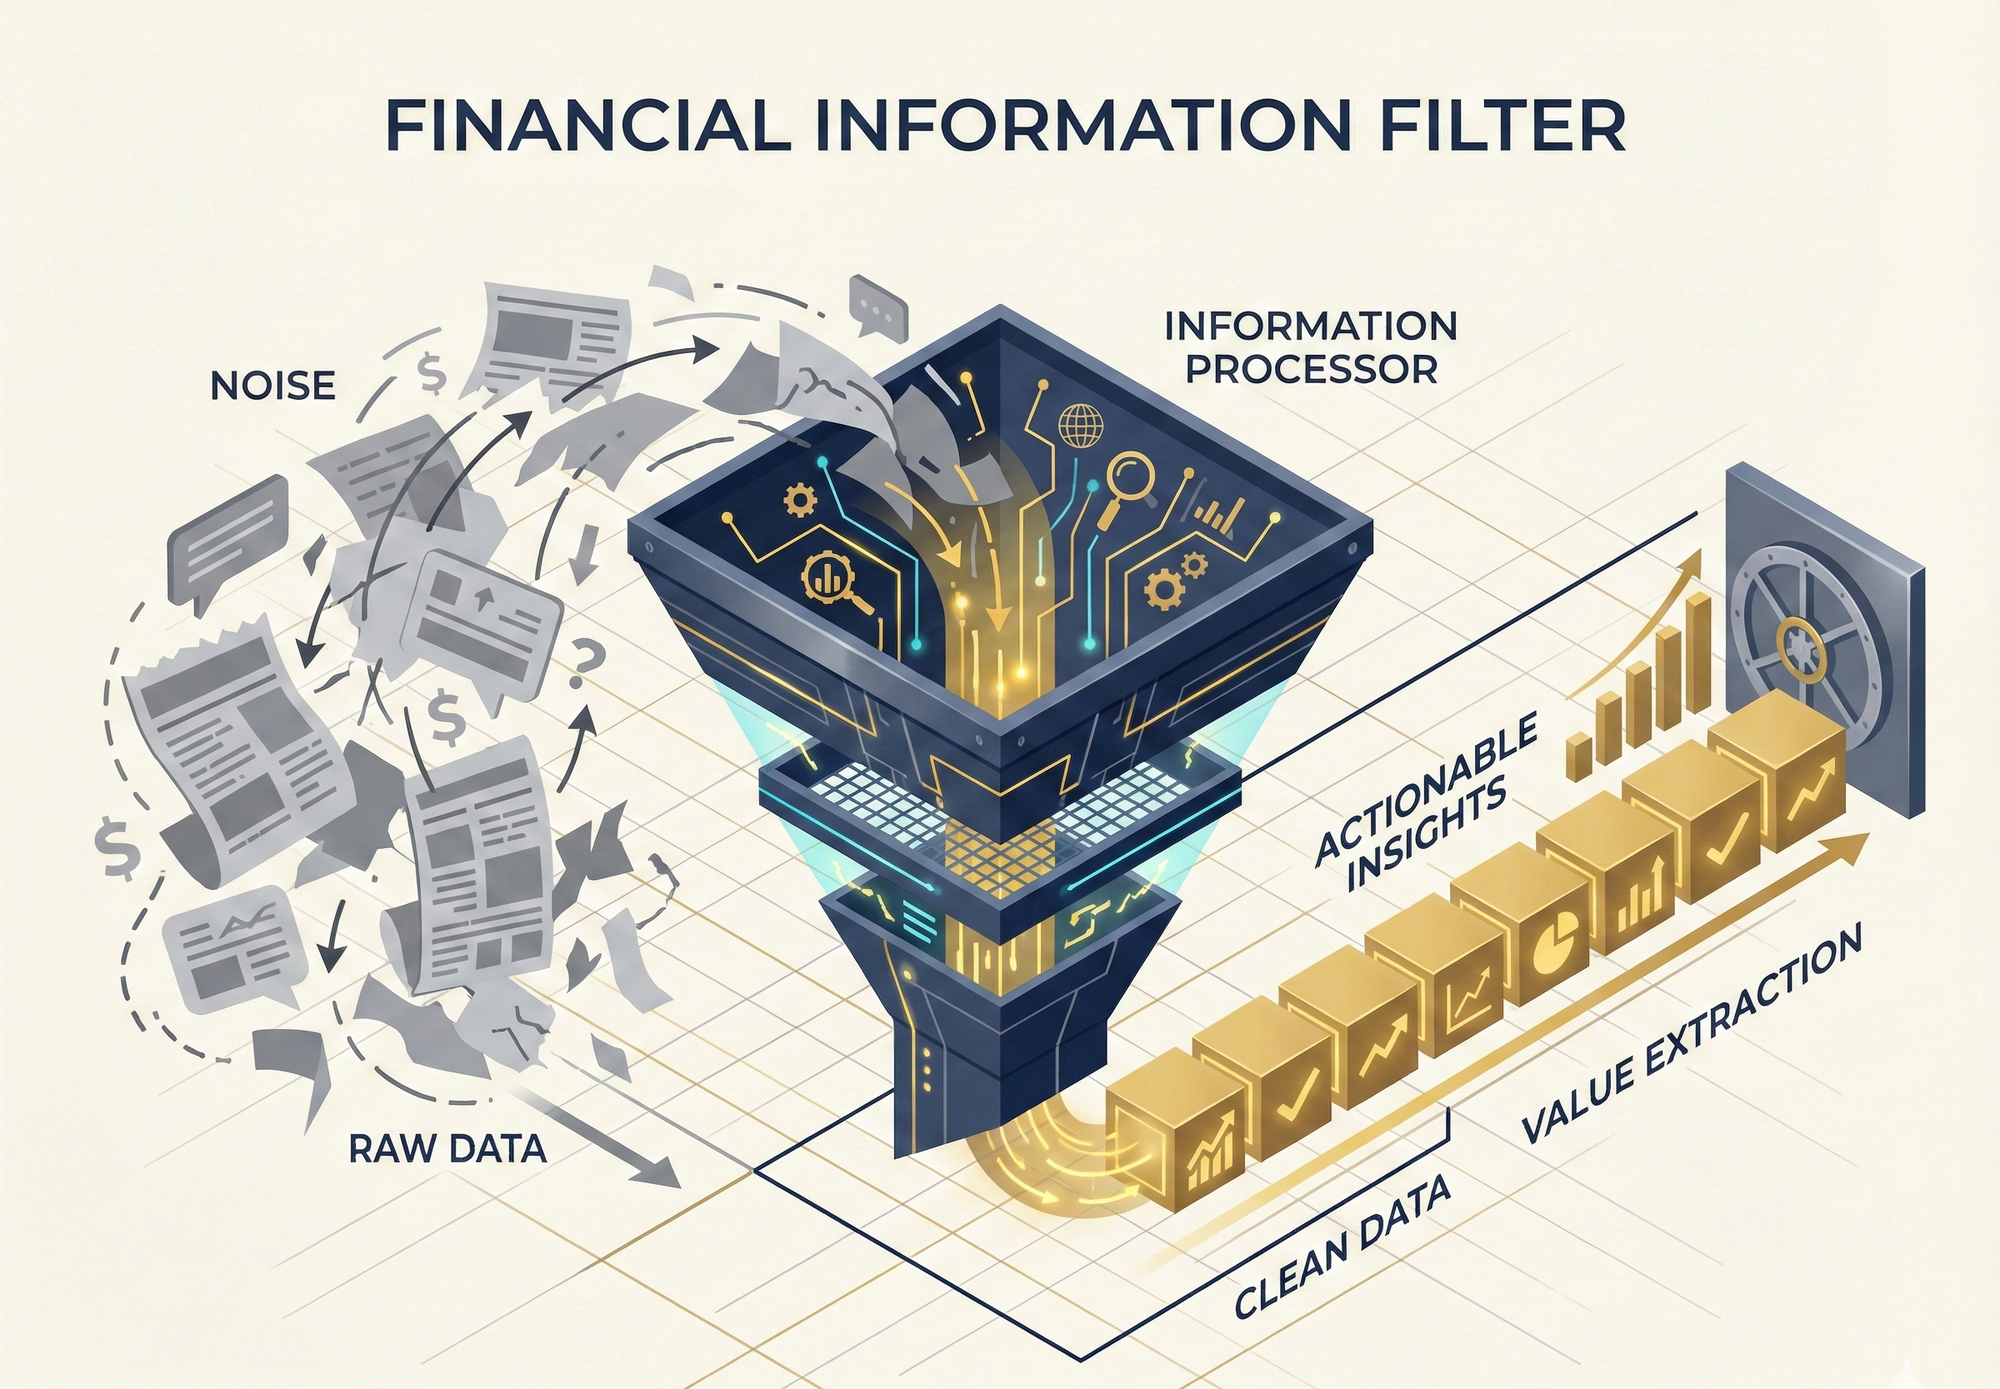
In today's information-saturated financial markets, what investors truly lack is never news, but rather a "mechanism for filtering out noise" and "market-leading data."
Why do retail investors always buy high and sell low? Why can institutional investors always position themselves before positive news is reported? The answer is singular: information asymmetry. Institutional players possess quantitative models to monitor fund flows and vast teams of analysts to forecast earnings, while most investors can only rely on lagging stock prices and secondary news.
We are committed to breaking this asymmetry.
We do not offer ambiguous advice; instead, we deliver an "institutional-grade decision-making system." Through our proprietary quantitative fund flow model, combined with AI computation and the qualitative insights of industry experts, we produce two in-depth strategic reports for you every week. This isn't just information; it's a tool to help you think like a top-tier fund manager.
📊 Core Product 1: "Industry Flow Weekly"
—— Exclusive Quantitative Engine x AI Qualitative Insights: Unlocking the True Trajectory of Smart Money
The most honest indicator in the market isn't news, it's "money." However, the fund flows of major players are often hidden amidst massive amounts of trading noise. We don't rely on linear statistical tools; what we deliver to you is an "institutional-grade gold-hunting system."
1. Core Engine: High-Dimensional Data and Non-Linear Machine Learning Integration
"The Alpha is in the Matrix." Market-available fund flow analysis often only scratches the surface of "who bought and who sold." Our model is built upon a High-Dimensional Dynamic Matrix, integrating massive amounts of heterogeneous data such as broker branch inflows/outflows, detailed transactions of the three major institutional investors, margin lending and short selling structures, and securities borrowing and lending balances.
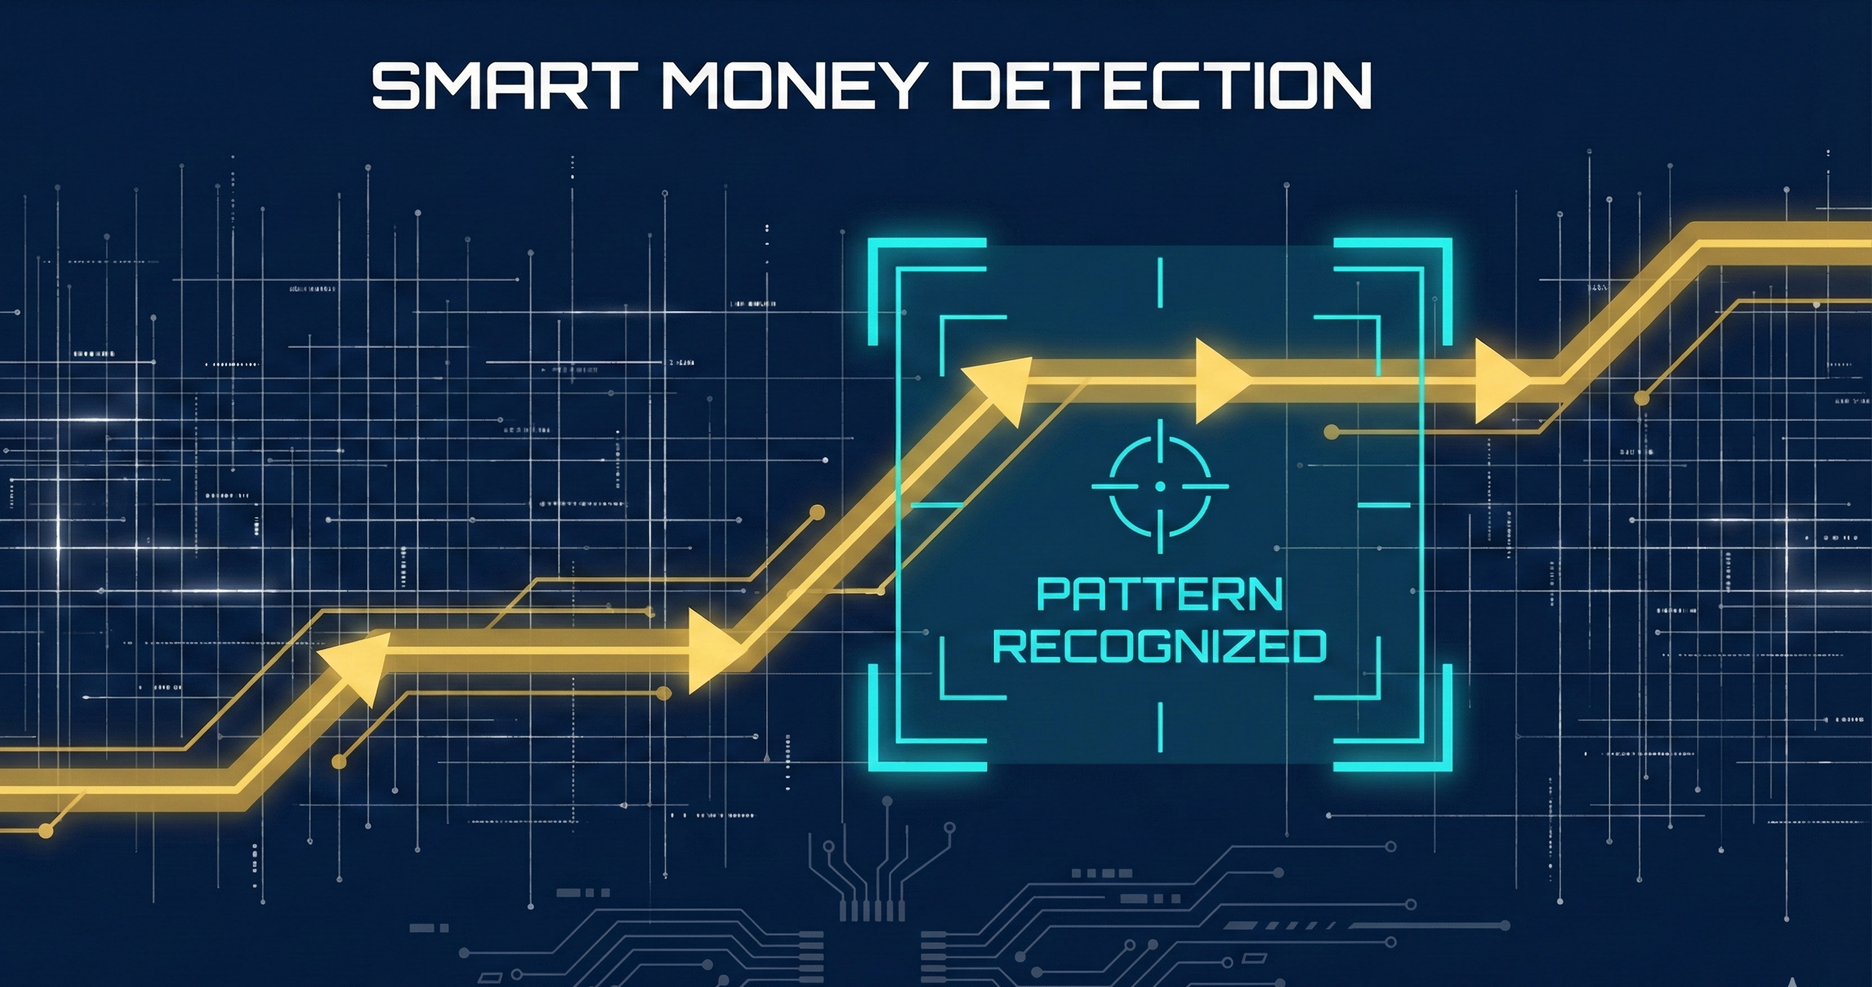
What most people see as noise, our AI identifies as signals. We utilize advanced Machine Learning algorithms to perform Non-Linear Analysis on the aforementioned high-dimensional data. This system has undergone rigorous Backtesting validation, effectively cutting through market noise to identify abnormal correlations imperceptible to the human eye—precisely capturing the subtle positioning movements of "major players" and "Smart Money" in the market.
2. AI Empowerment and Qualitative Validation: From "Fund Signals" to "Industry Logic"
Data can only tell you "What happened," but interpreting it with intelligence tells you "Why." Identifying what major players are buying is merely the first step; understanding "why they are buying" is the key to profit. This is our greatest distinction from traditional quantitative methods:
- AI Scan of Global Reports: After our quantitative model identifies individual stocks with abnormal capital inflows, we activate our generative AI engine to automatically scan and analyze vast amounts of foreign institutional reports, earnings call transcripts, and industry news, building a "fundamental profile" of the company within seconds.
- Deep Integration of Expert Perspectives: Following the initial AI screening, we perform a secondary validation by incorporating insights from seasoned industry experts. We dissect the driving forces behind these fund flows—is it merely inventory replenishment (short-term)? Or is it a structural surge (long-term) driven by technological upgrades (e.g., CPO, CoWoS)?
3. Final Output: Predicting the Next Mainstream
Flow Precedes Price. This is not a backward-looking report, but a forward-looking strategic map. By cross-referencing "Smart Money movements" with "industry logical inflection points," we can proactively anticipate the themes and sectors most likely to attract capital inflow next week.
This means that while the general market is still chasing highs based on news, you, armed with our integrated "mainstream theme forecast," will have already completed your positioning in sync with major players at the early stages of trend formation.
This is more than just fund flow analysis; it's a perfect closed-loop system of data, logic, and foresight.
📉 Core Product 2: "Consensus Alpha Weekly"
—— Focusing on the Semiconductor Industry, Unlocking Institutional-Grade "Expensive Forecast Data" to Capture Extreme Divergences Between Earnings and Price
Don't be misled by the name; "market consensus" isn't discussions among retail investors on forums, but rather the most expensive information asset in the financial world.
Ordinary investors can only read lagging news reports, but top-tier fund managers look at "Analyst Estimates" in professional financial terminals. This data compiles EPS and revenue forecasts rigorously calculated by top global investment bank analysts using sophisticated financial models.
This is a battle for information access. We subscribe to and integrate this high-value data, typically only available to institutional investors, and focus entirely on the "semiconductor industry," revealing the true narrative behind supply chain stock price fluctuations.
1. Core Logic: Scanning for the Semiconductor "Alpha Gap"
"Confidence Leads, Price Lags." Stock price is the market's "present tense," but analyst estimates are the "future tense." Every week, we systematically monitor changes in institutional consensus for the semiconductor supply chains in Taiwan and the US.
- Information Arbitrage: When we discover that the consensus EPS for a certain semiconductor stock is significantly revised upwards by analysts collectively, but its stock price is suppressed due to market noise, the enormous Gap between them represents the "Alpha" (excess returns) that retail investors don't see, but institutions are eagerly seizing.
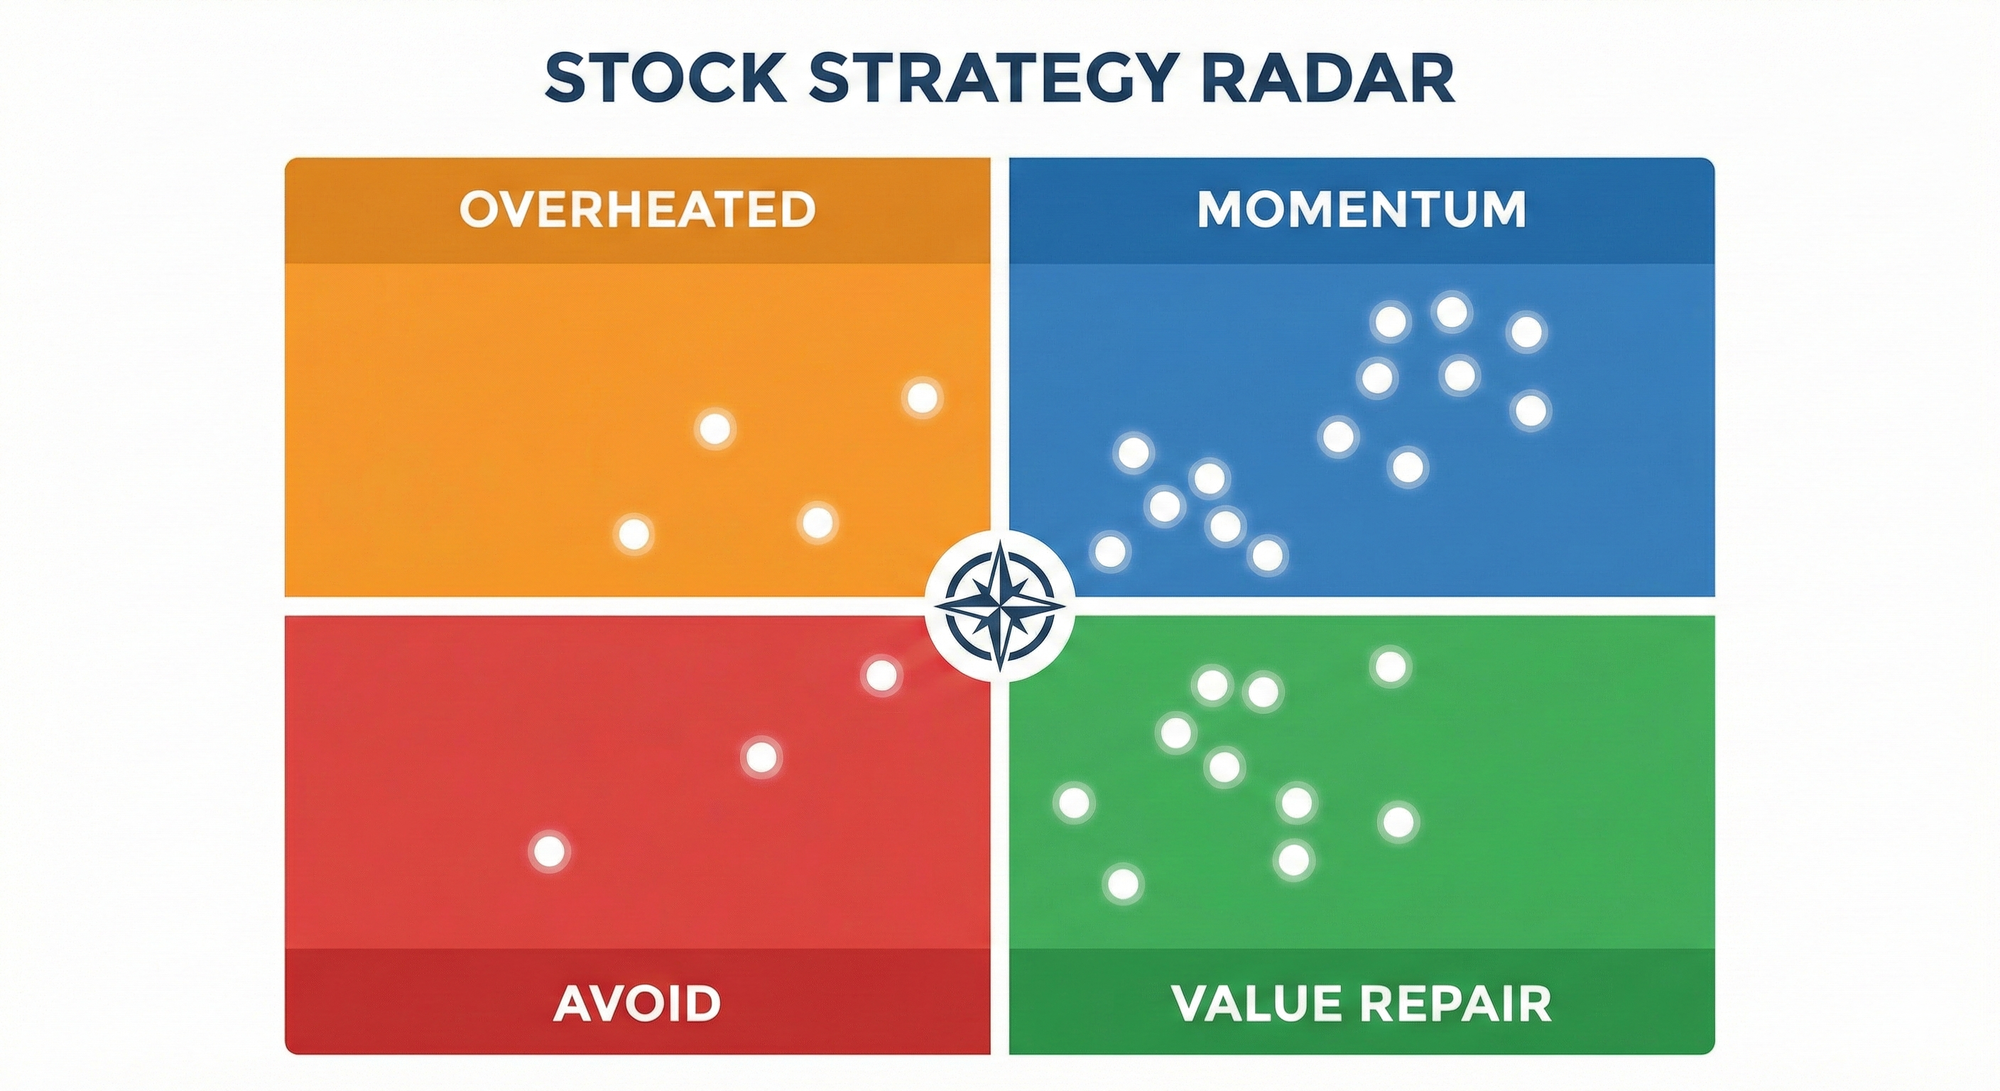
2. Exclusive Visualization: Four-Quadrant Strategic Radar (Alpha Radar Strategy)
We transform complex and tedious data into a "strategic map" that can be understood at a glance. By cross-referencing the X-axis (stock price momentum) and Y-axis (earnings recovery), we precisely position semiconductor stocks into four battle zones:
- 🟢 Value Zone: Significant earnings growth but falling stock price (this is the perfect overlooked buying opportunity).
- 🔵 Momentum Zone: Earnings and stock price rising in tandem (strong hold).
- 🟠 Overheated Zone: Stock price gains far exceeding earnings recovery (take profit).
- 🔴 Collapse Zone: Earnings downgraded and stock price breaks key support levels (strictly avoid). This chart will serve as your best dashboard for reviewing the health of your holdings every week.
3. Interconnected Taiwan-US Supply Chains: Cross-Border Leading Indicators
Taiwan's semiconductor industry is at the core of the global supply chain, and looking solely at stocks in Taiwan is insufficient. We uniquely incorporate a linked analysis of "US stock leaders vs. Taiwanese stock supply chains."
- Lead and Lag: US stocks (such as NVIDIA, Broadcom) often serve as leading indicators for stocks in Taiwan. When the earnings outlook for US stock leaders is revised upwards, we can immediately identify which Taiwanese supply chain component (such as packaging and testing, thermal management, IP) has not yet reacted, helping you identify opportunities for "time-lag arbitrage."
This is more than just a report; it is a semiconductor investment navigation system that delivers "the institutional perspective" to you affordably.
🎁 Bonus Content: Deep Dive
—— Connecting the Dots, Seeing the Full Industry Picture
In addition to the two regular weekly reports, we irregularly publish major special reports that structurally deconstruct critical market events:
- Key Earnings Call Interpretations: For bellwether stocks like TSMC, we don't just interpret financial figures; we deeply analyze the technology roadmap and industry implications behind capital expenditure (CapEx).
- International Exhibitions and Trends: From CES and Computex to the GTC conference, we distill the latest developments in semiconductors and AI for you.
- Structural Trend Analysis: We explore long-term themes such as CoWoS capacity bottlenecks and the evolution of silicon photonics technology, enabling you to profit not only from volatility but also from long-term trends.
Why Choose Us?
We have taken a less-traveled path, yet one that represents the future mainstream: Quantamental (Qualitative + Quantitative).
In modern financial markets dominated by algorithms, Data is the battlefield terrain, and Insight is the winning strategy.
Most investors can only chase highs and sell lows based on the lagging indicator of "stock prices," while top institutional investors hold "fund flows" and "estimates"—these leading indicators—to position for the future. We are dedicated to bridging this enormous information gap for you.
Unlike analyses on the market that solely rely on charts or personal experience, we deliver a "Quant Fund Level" decision-making system:
- Absolute Objectivity of Quantitative Data: We do not rely on subjective intuition but on models validated through backtesting. From fund flow directions to analyst consensus, every conclusion and analysis is supported by massive data computations, ensuring discipline and consistency in investment decisions.
- "Evolving" Intelligence of AI and Experts: This is a growing system. We leverage AI's powerful computational capabilities to quickly digest market-wide research reports and combine them with the forward-looking insights of industry experts for validation. As our AI models iterate and develop, our ability to capture information and interpret trends will only become stronger and more precise.
This is more than just a subscription; it is your "Quantitative Investment War Room" every Monday morning.
Here, data is no longer just cold numbers, but your most rational and powerful profit moat in the era of AI.
Join now and experience the Quantamental investment advantage.

![[Industry Capital Flows Weekly] 20260309 Capital Reallocation and Micro-level Capital Flow Divergence in AI Infrastructure](/content/images/size/w1200/2026/03/Gemini_Generated_Image_9yzcdz9yzcdz9yzc-1.png&q=100)
![[Industry Capital Flows Weekly] 20260215 Capitalizing on AI Specification Bonuses, Avoiding Equipment Makers' Book-Closing Sell-off](/content/images/size/w1200/2026/03/Gemini_Generated_Image_mq6ktymq6ktymq6k-1.png&q=100)
